Rebuilding Growth
Around the Right Customer

FinTech • B2B SaaS • DX Strategy • Acquisition
An 18-month system redesign transformed fragmented acquisition for a B2B financial platform into a revenue-driven engine with measurable results in 30 days.
ROLE
CRO & Digital Experience Strategy Consultant
OWNERSHIP
End-to-end acquisition, conversion, and onboarding strategy

Overview
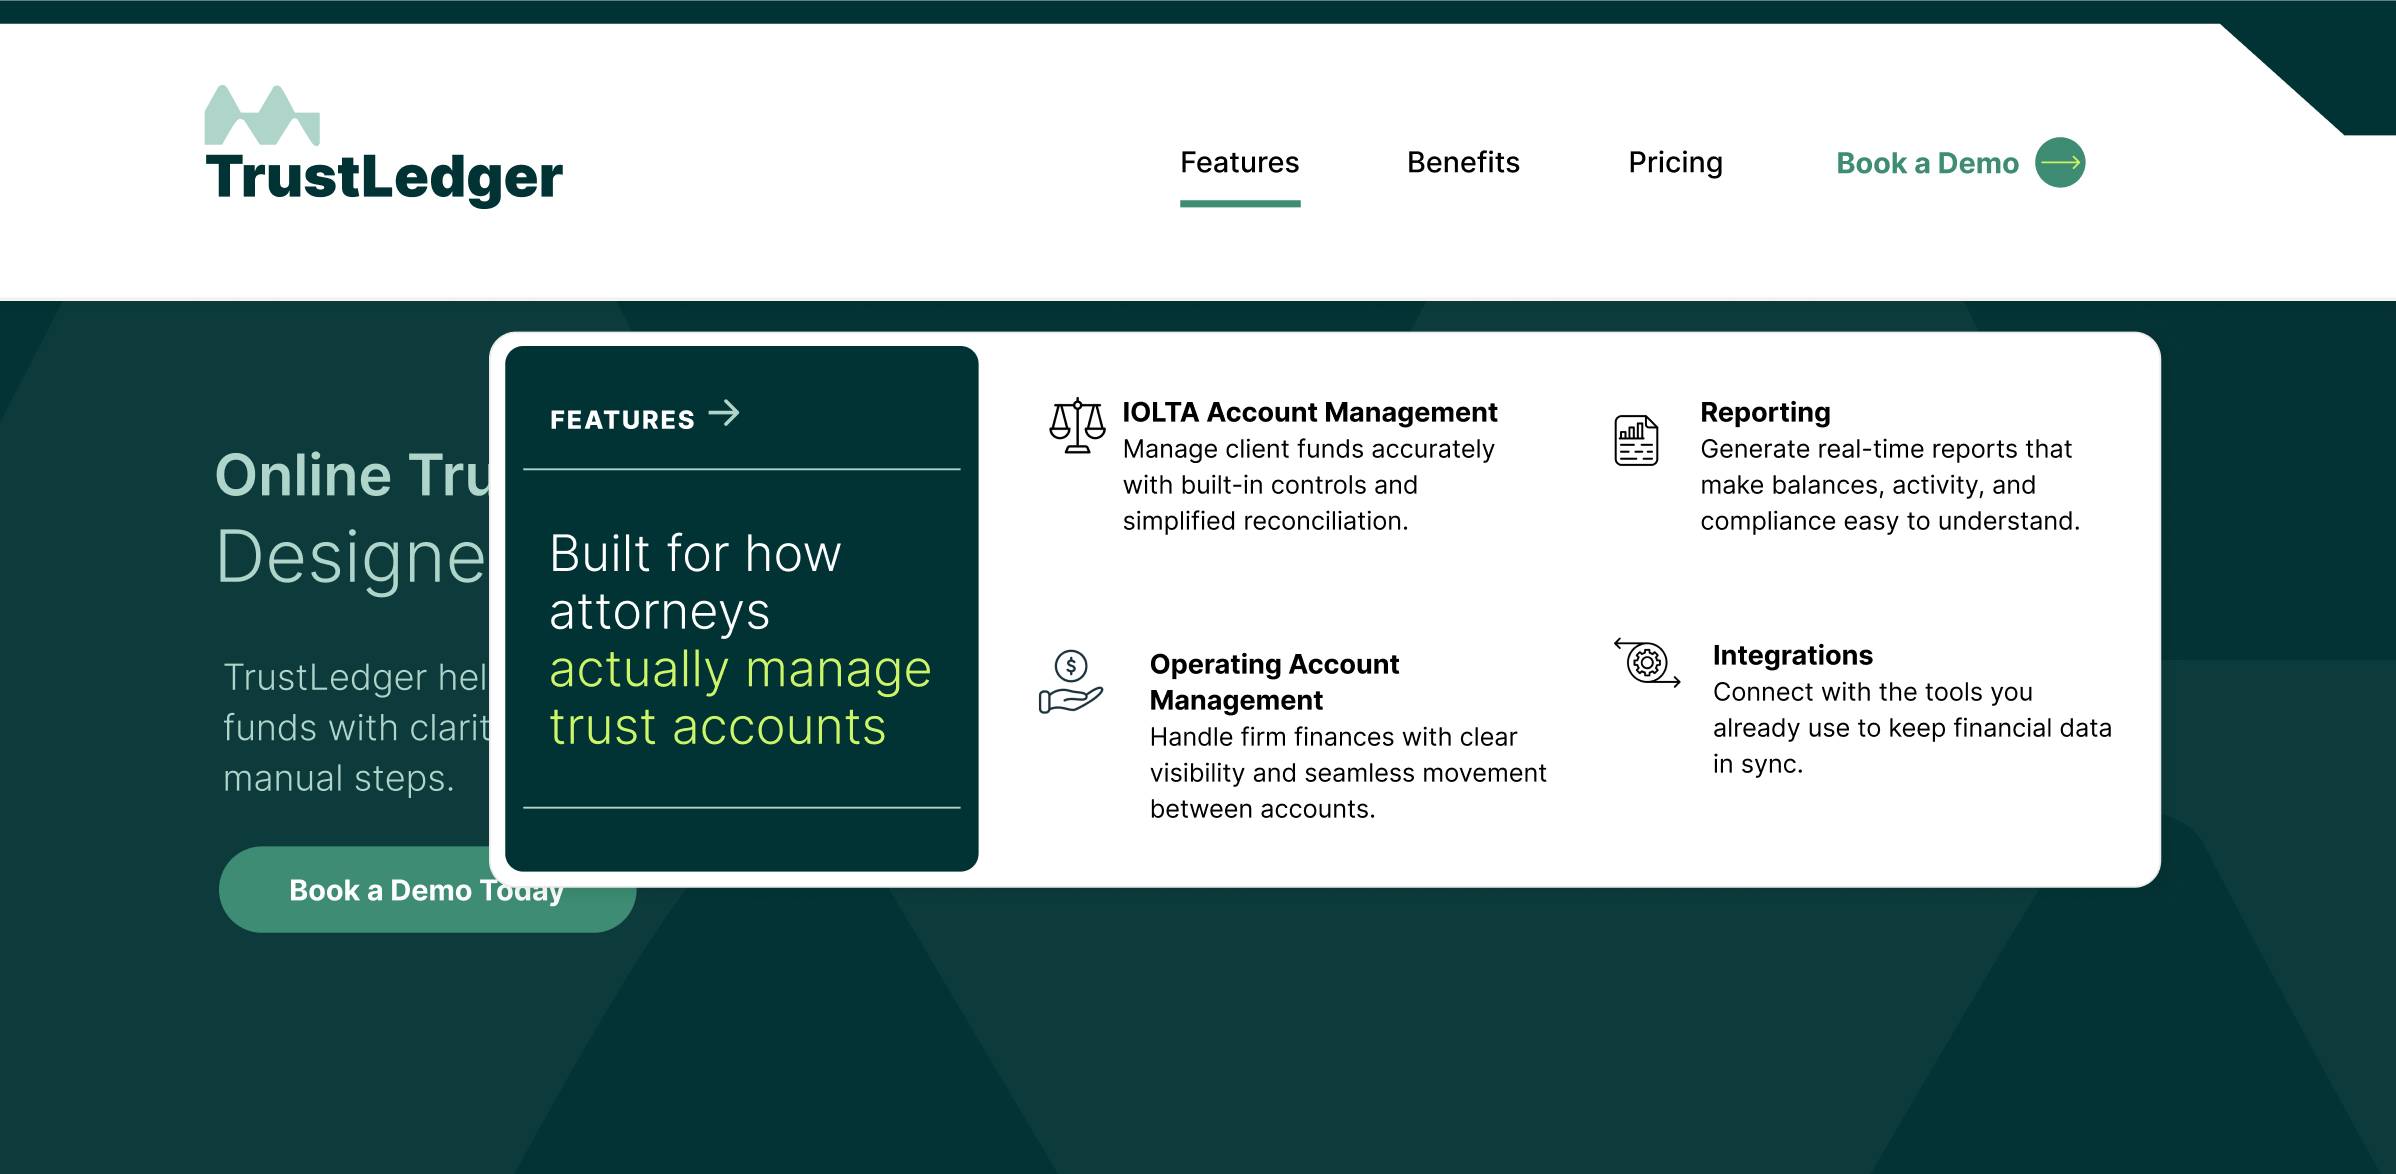
TrustLedger is a fintech platform built for law firms to manage both operating accounts and trust (IOLTA) accounts in a single system.
Most firms rely on disconnected tools: banking platforms, accounting software, and manual reconciliation; creating delays, risk, and operational friction.
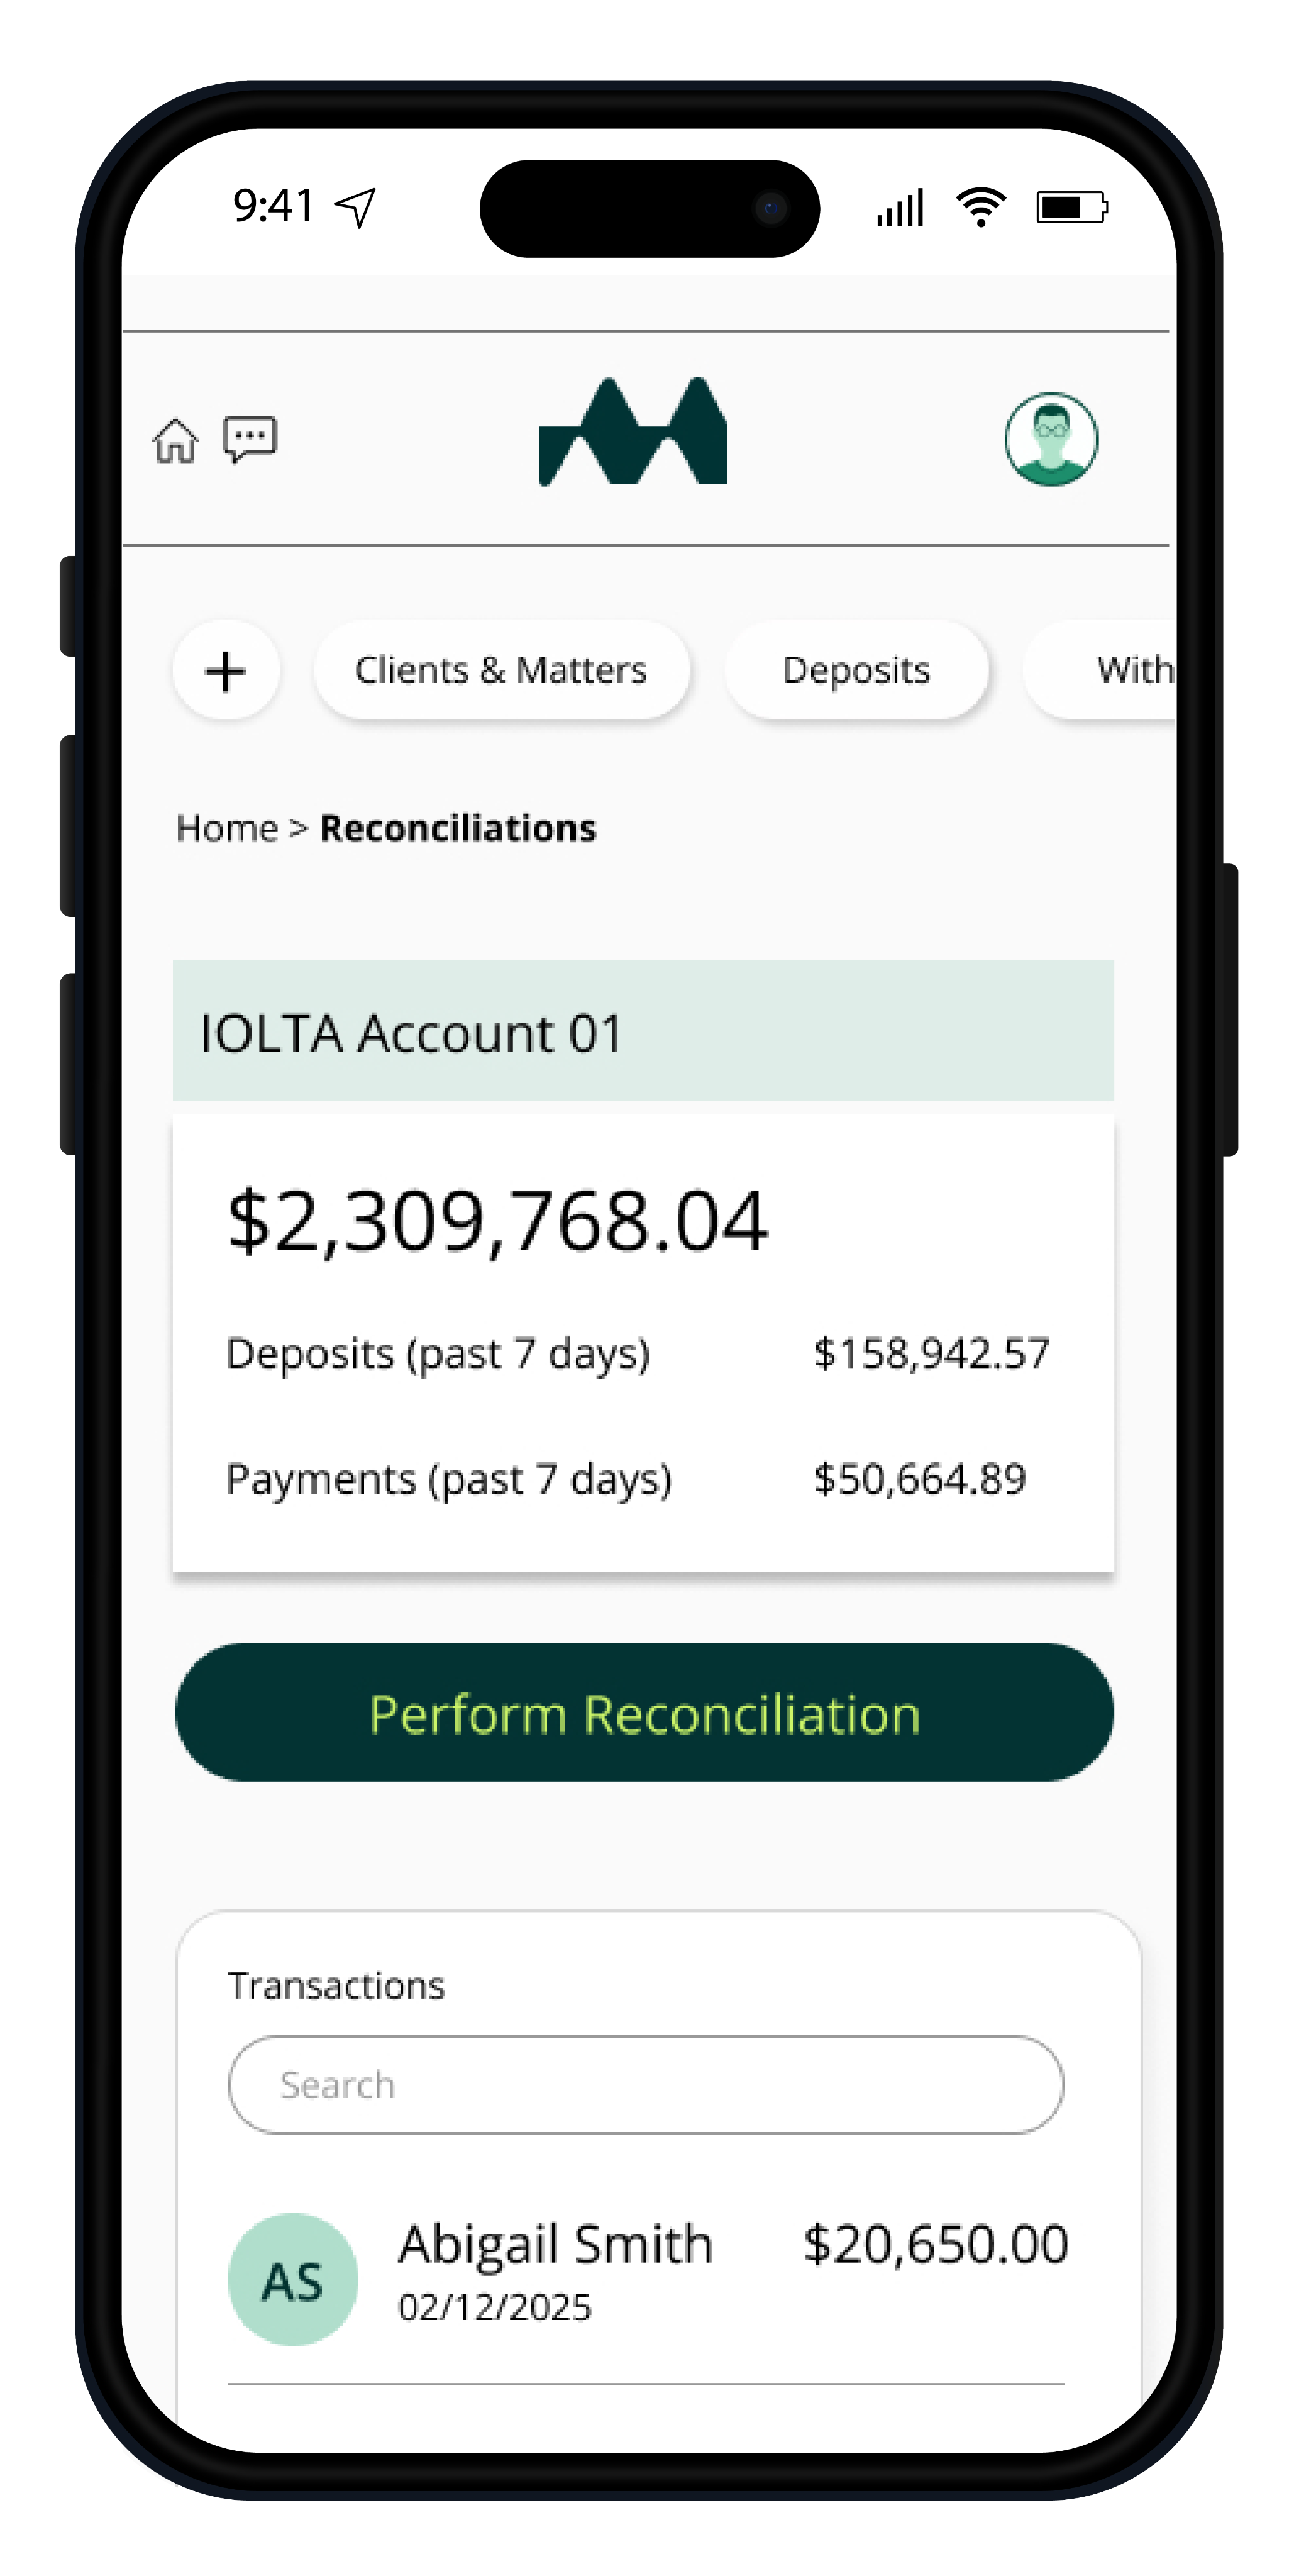
TrustLedger unifies financial workflows into a single, real-time system.
The product was strong.
But growth wasn’t.
The Problem
Strong Product. Misaligned Growth.
The issue wasn’t demand.
The system was optimized for activity, not value.
At a glance, performance appeared stable:
Paid media generated leads.
Traffic was consistent.Campaigns were active.
But revenue told a different story:
Lead volume was high, but pipeline quality was inconsistent.Sales cycles were long and unpredictable.Many customers lacked the financial profile to drive meaningful revenue.
The Reality
Multiple Funnels. Conflicting Signals.
Acquisition wasn’t a single funnel, it was a fragmented system.
Paid search targeting broad, mixed-intent queries
Paid social campaigns optimized for awareness, not qualification
Organic traffic driven by weak positioning and poor site architecture
Offline and referral channels driving the majority of actual conversions
Each funnel operated independently.
Each optimized for different behaviors.
But all were measured the same way.
The Diagnosis
Separating Signal from Noise
I led a mixed-method research effort to understand what was actually driving performance.
Data Sources Included:
Sales Insights/Qual Data
Gong, SurveyMonkey
CRM + Pipeline
Hubspot
Conversion + Attribution
GA4, PostHog
Revenue + Account Data
Looker
Behavior + Product Usage
Pendo, DataDog
Channel Performance
GoogleAds, Meta, LinkeIn
This analysis revealed a critical disconnect.
High-value customers followed longer, more complex journeys.Lower-value customers converted quickly—distorting performance metrics.
A key finding:
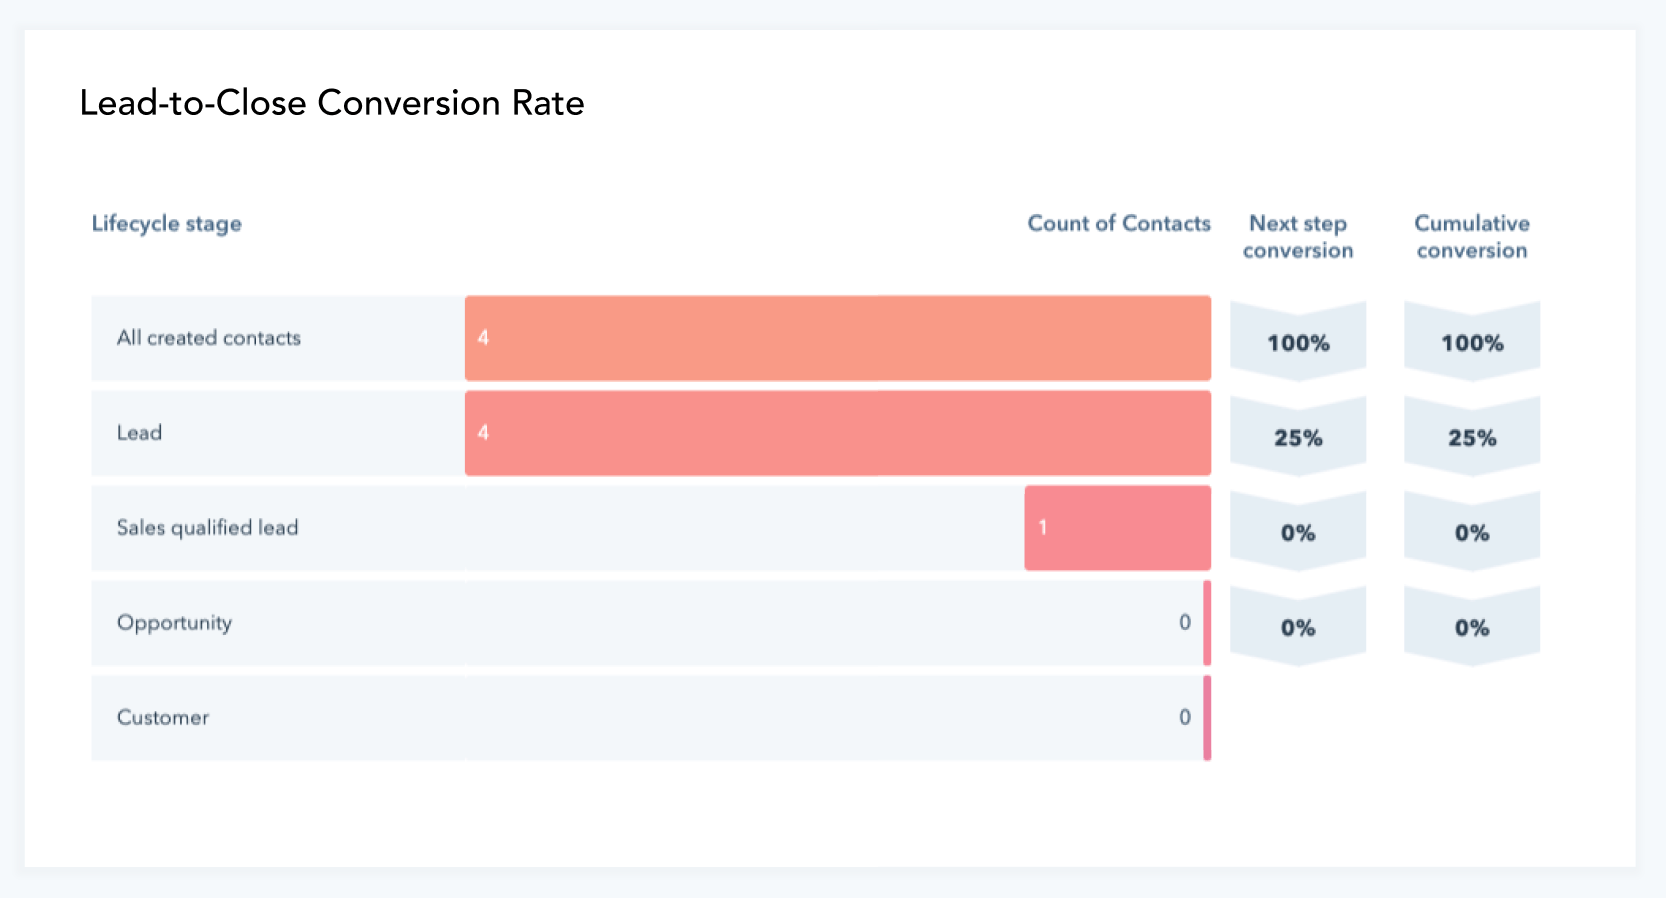
Average lead-to-close time was ~80 days. Yet, CAC was evaluated in real time using first-touch attribution.
This meant:
- High-value customers were undercounted
- Low-value leads inflated performance
- Channel effectiveness was misunderstood
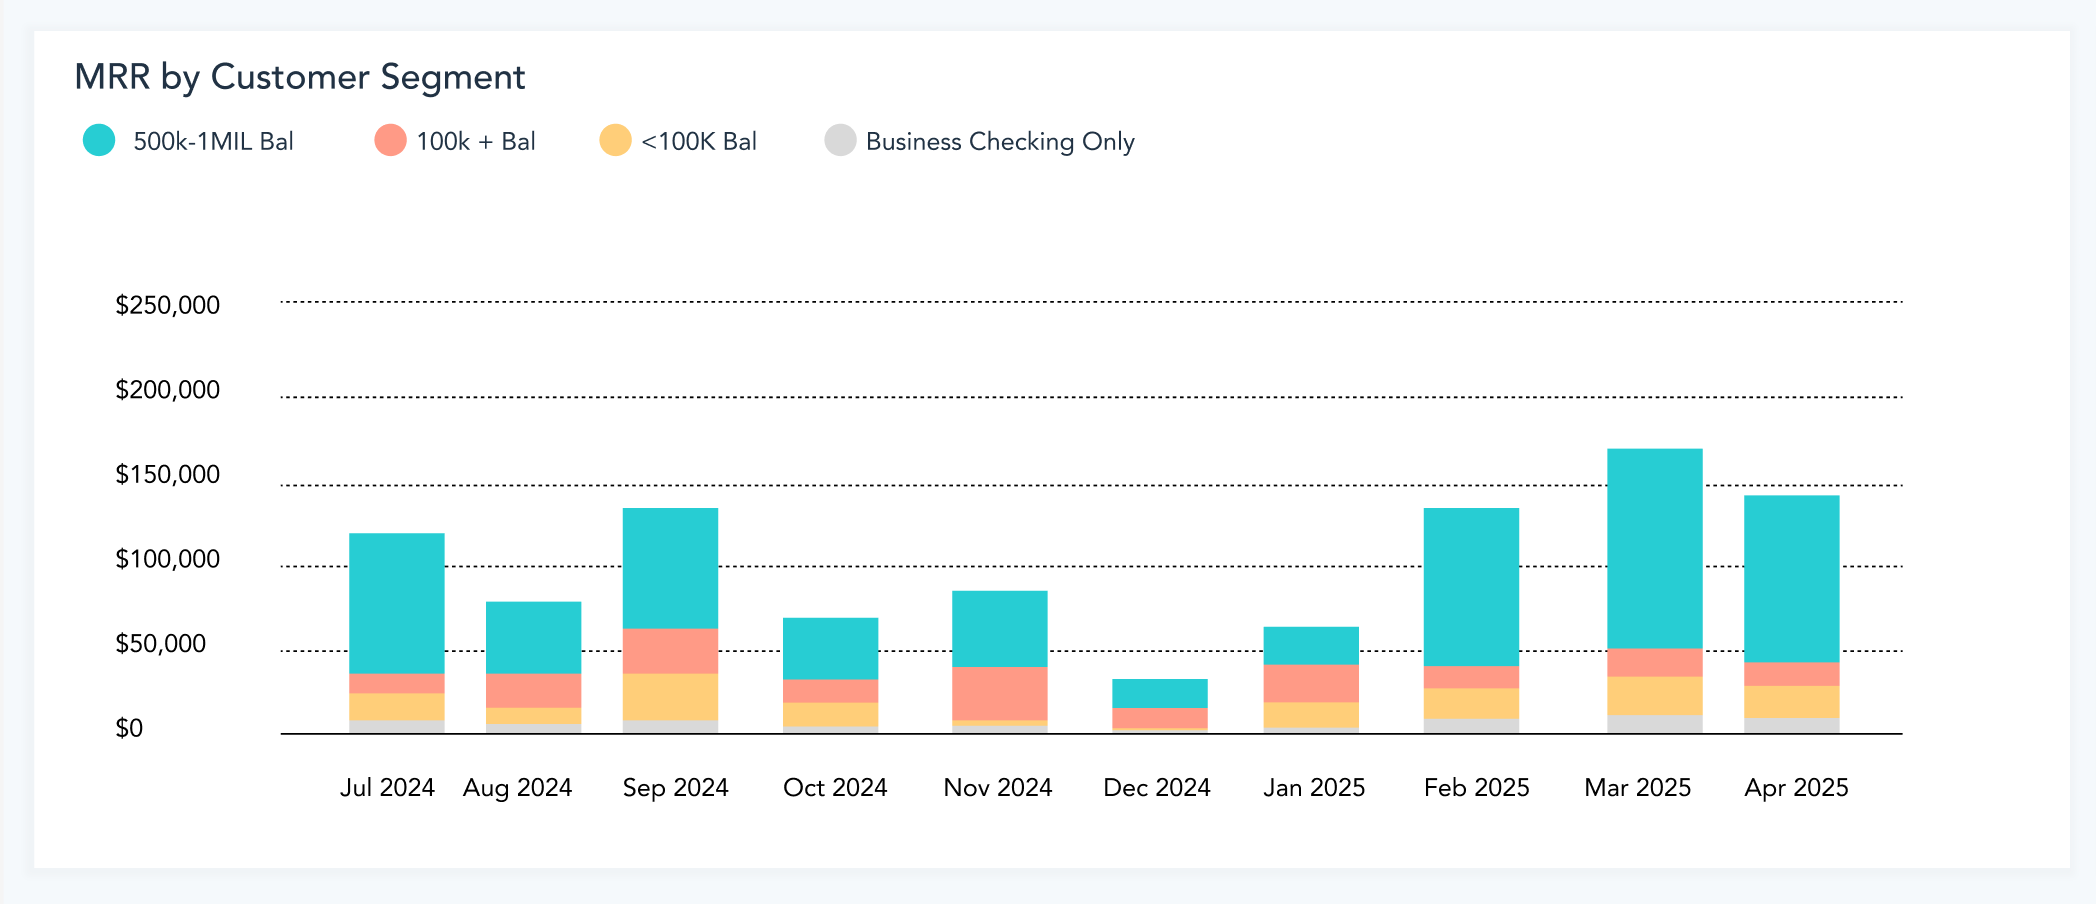
Findings were operationalized through a detailed report and executive dashboards, built with data engineering and surfaced in BI platforms; the charts below are a small sample used in C-suite readouts.
The Insight
Not All Customers Are Equal

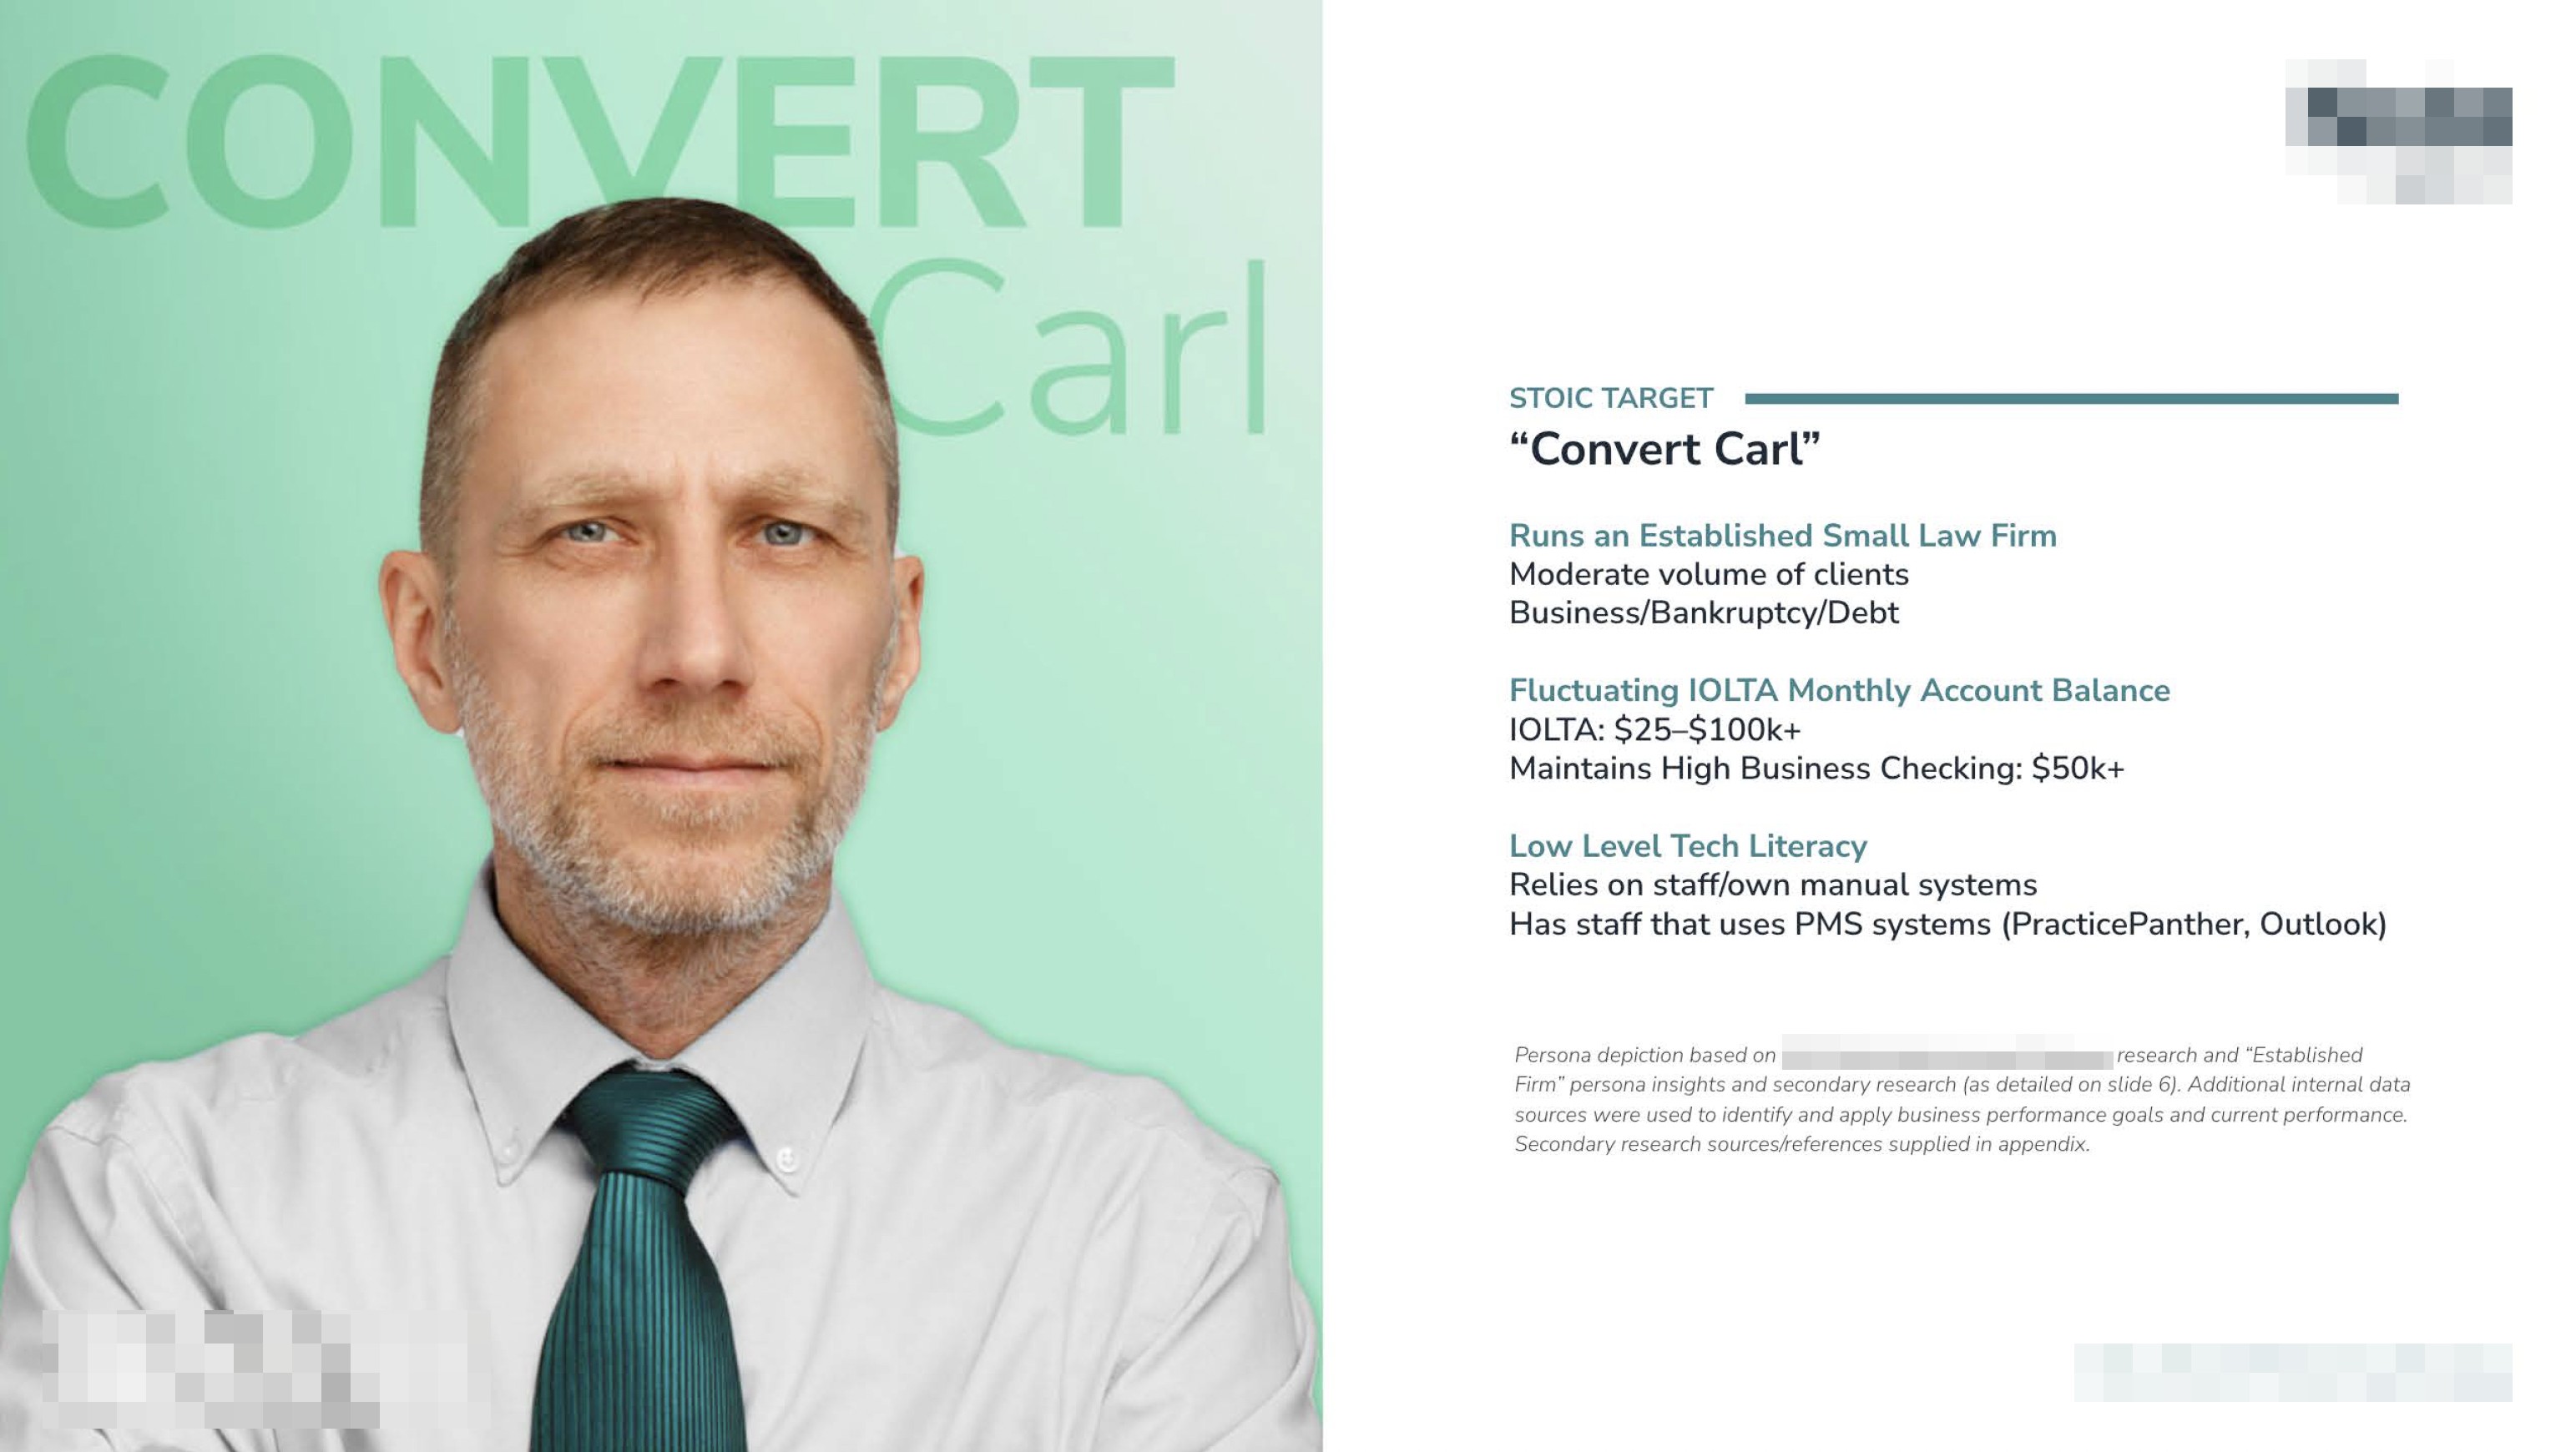
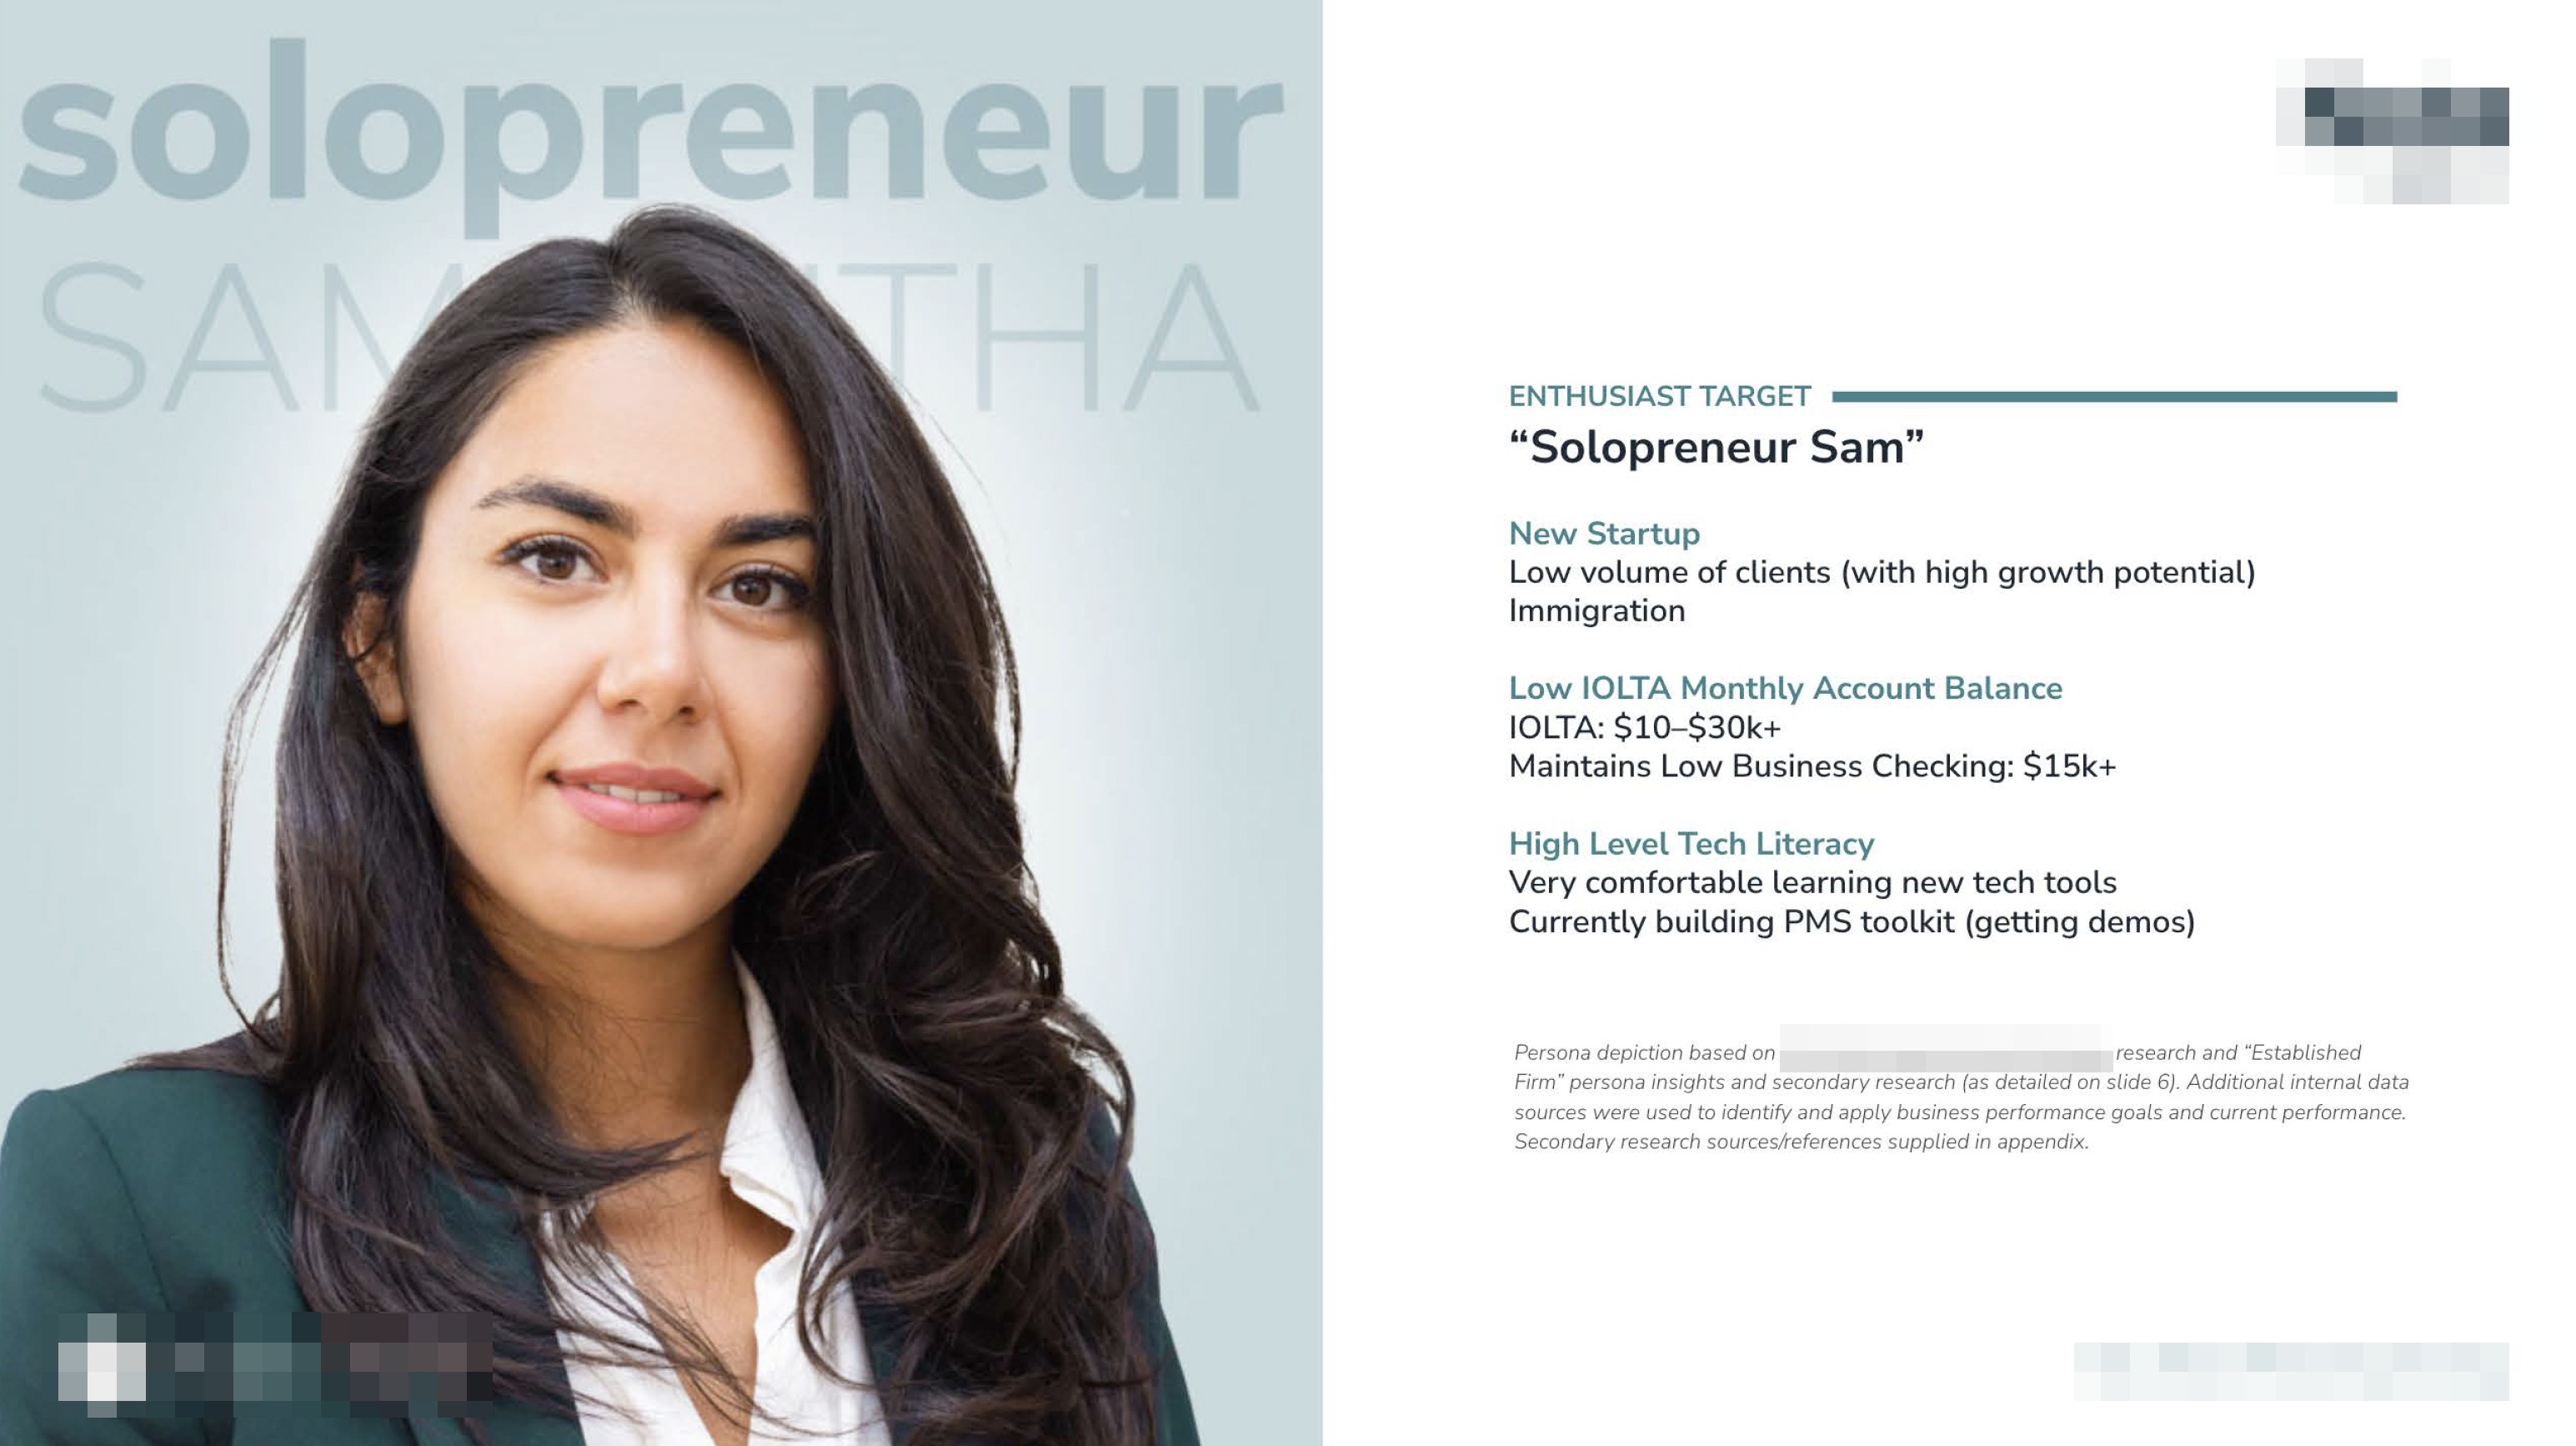
The strategy treated all customers the same, data proved they weren’t. So, I defined key segments and mapped exactly how and where to personalize across the journey.
I Replaced Assumption With Evidence
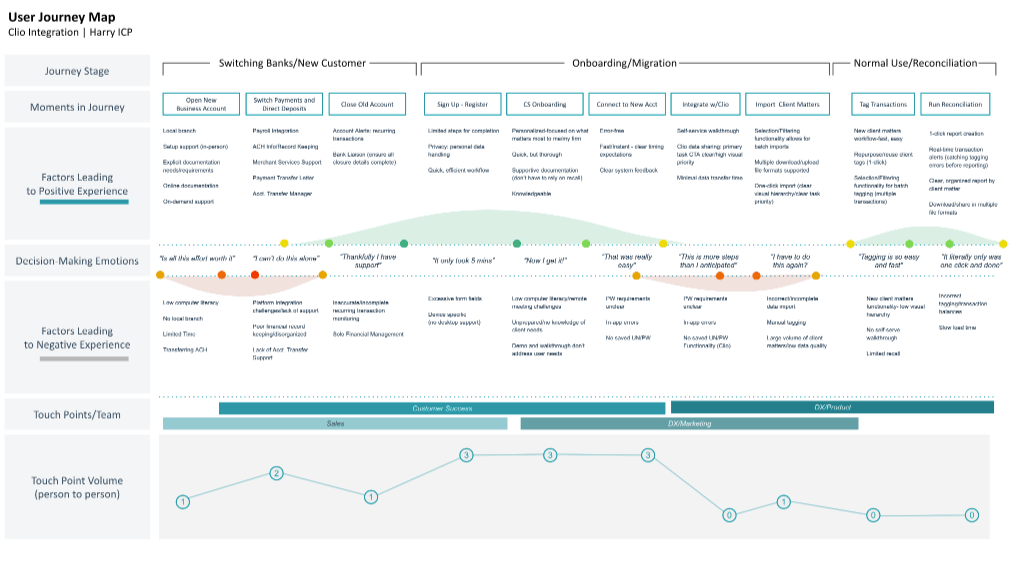
By mapping data-informed journeys end-to-end, I identified:


Which customers actually generated revenue
Which channels influenced high-value conversion
Where friction existed across the experience
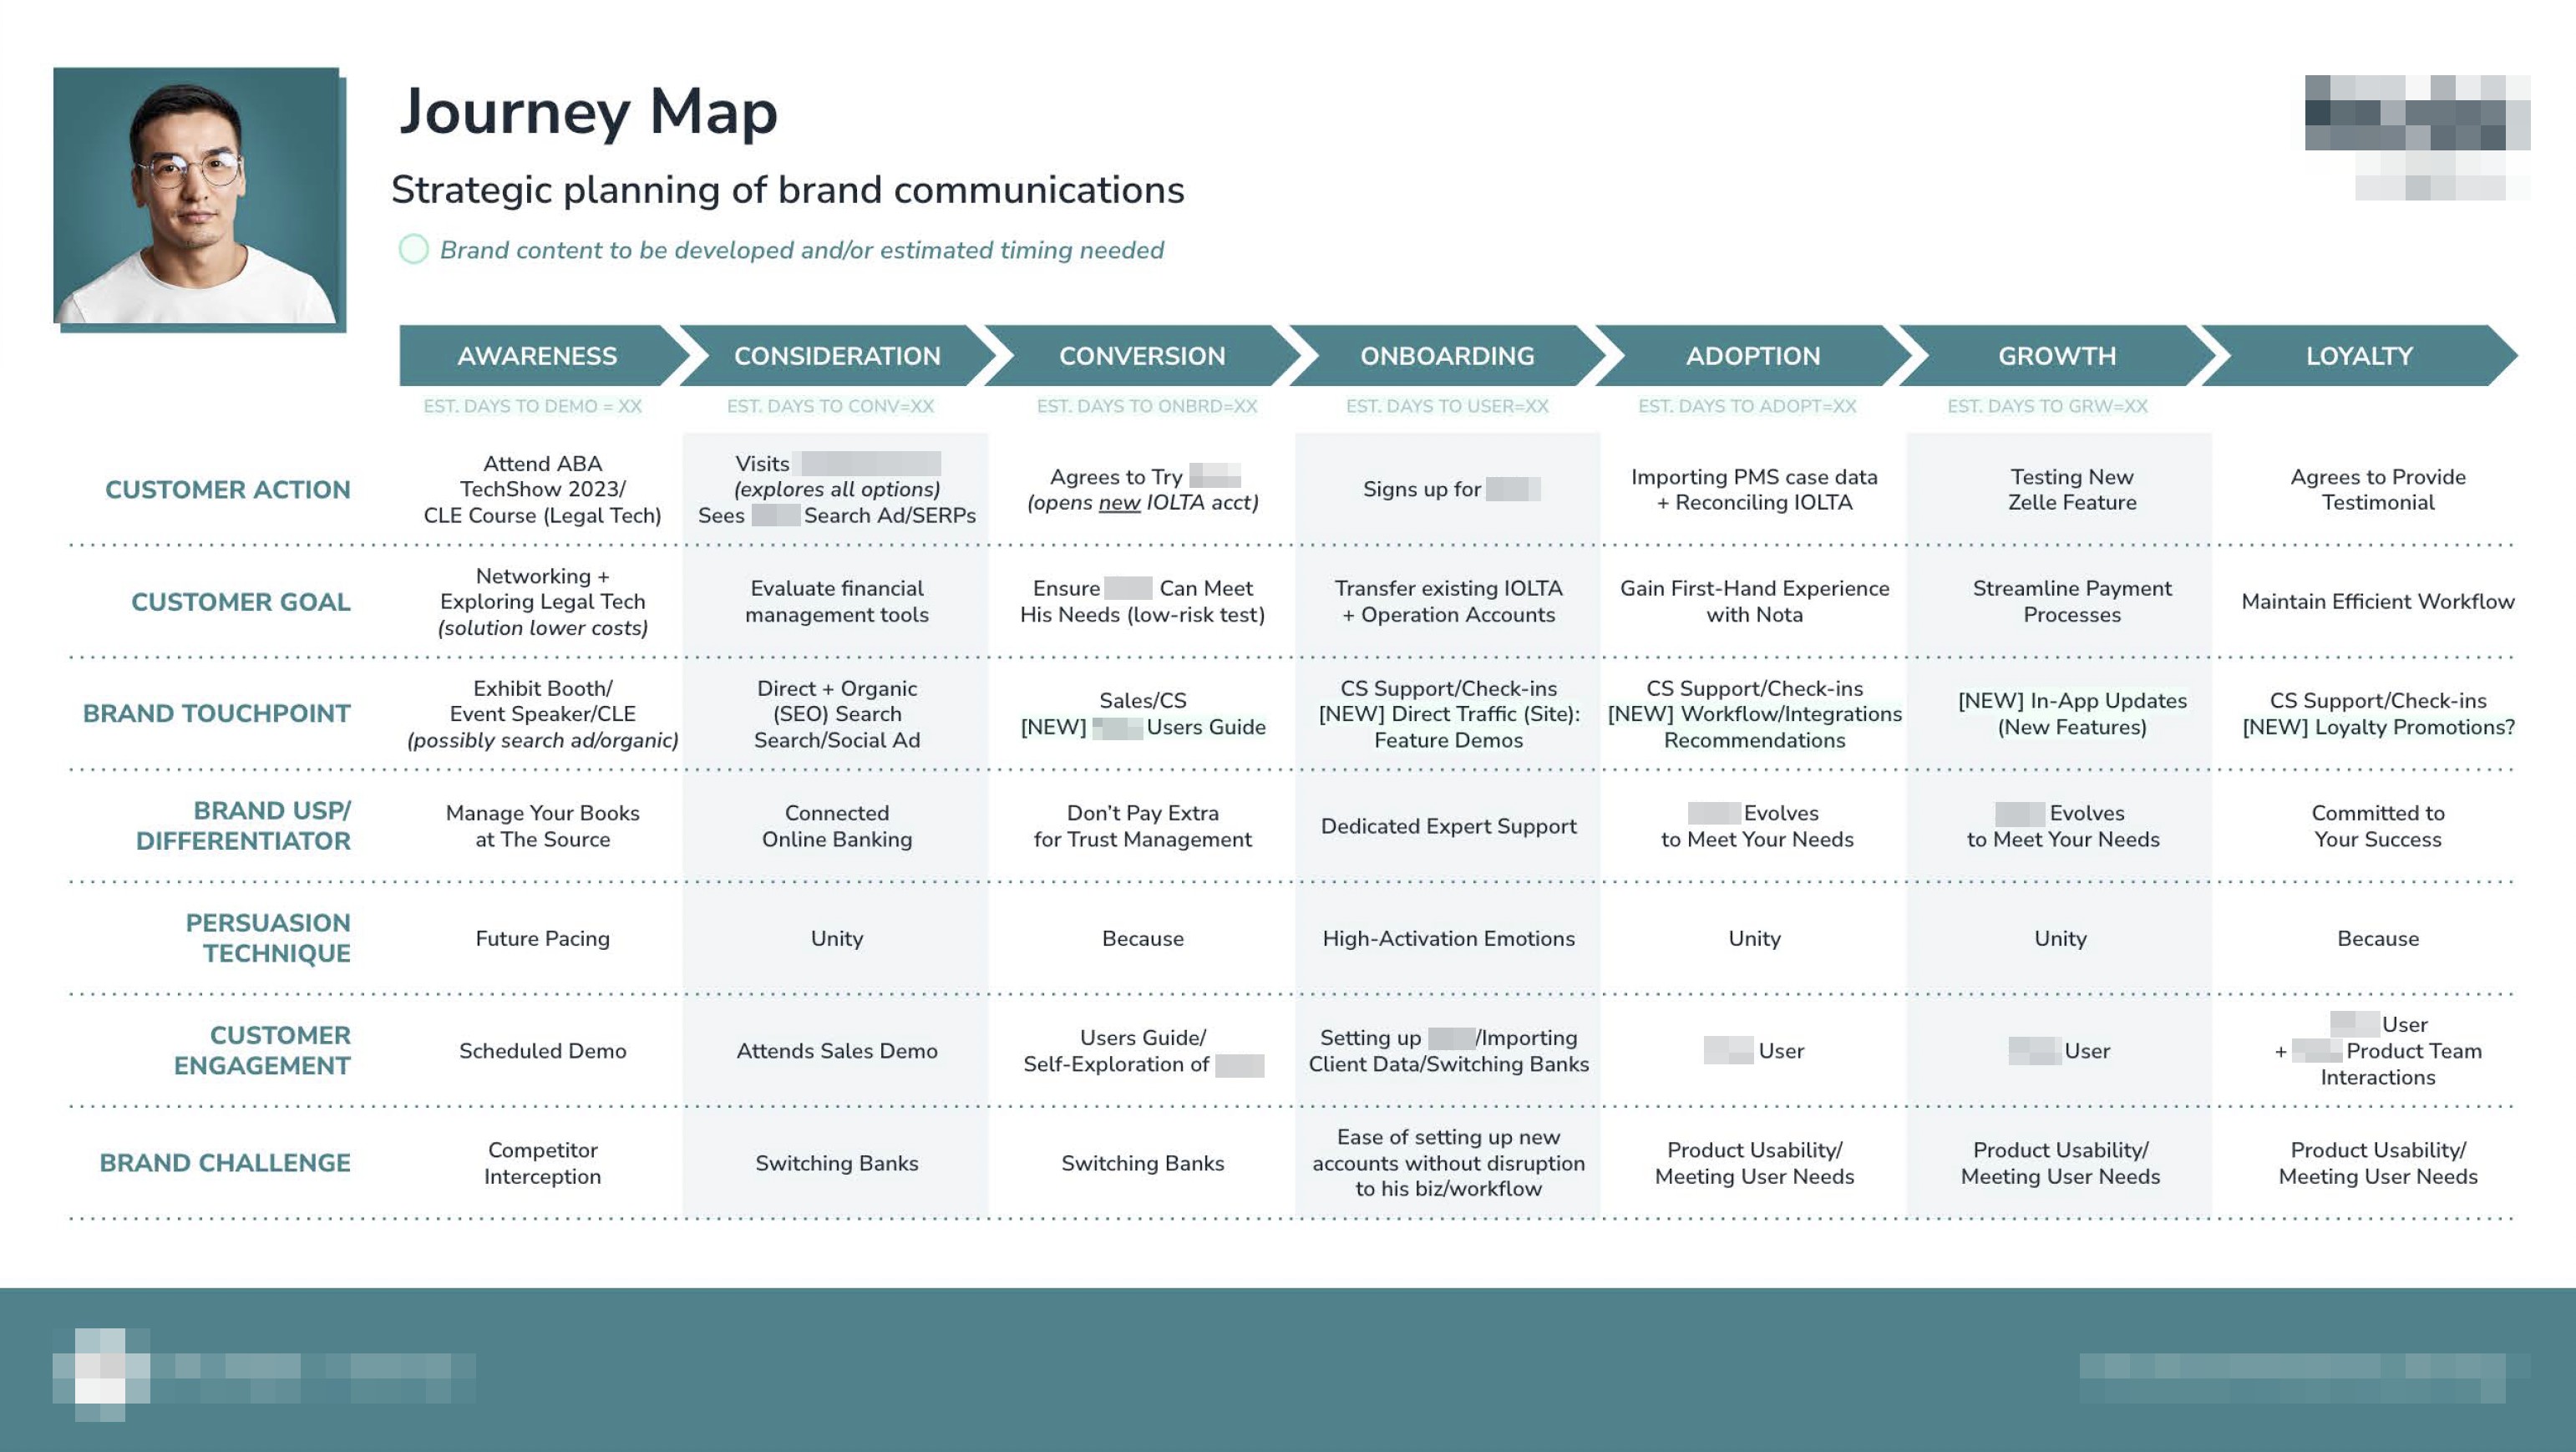
I then detailed the opportunities across acquisition and adoption to attract, engage, and convert users into longtime customers
The Strategy
Rebuilding the System Around the Right Customer
The strategy operated as an integrated system where customer profiles shaped messaging, messaging guided channel strategy, channels drove conversion design, and conversion generated data that continuously refined the entire system creating a feedback loop that improved targeting, messaging, and performance over time rather than relying on isolated campaigns.
I redesigned the growth model as a connected system aligned to customer intent, behavior, and value. Instead of one funnel, I built multiple persona-driven pathways.
This included:

Repositioning messaging around real decision drivers (accuracy, control, compliance)

Aligning paid, organic, and lifecycle channels to different stages of evaluation

Redesigning landing experiences to match entry context

Introducing first-party data capture to identify customer profiles at conversion
crm + lifecycle content
Turning Event Attendees into Qualified Leads
Personalized Flows
I designed email and nurture flows aligned to user intent for ICPs, Promising, and Early-Stage Profiles
Focused Messaging
I wrote content and defined the messaging strategy aligned to real evaluation concerns optimized for maximum CTR and CVR
Personalized ICP Email

Promising Profile Email
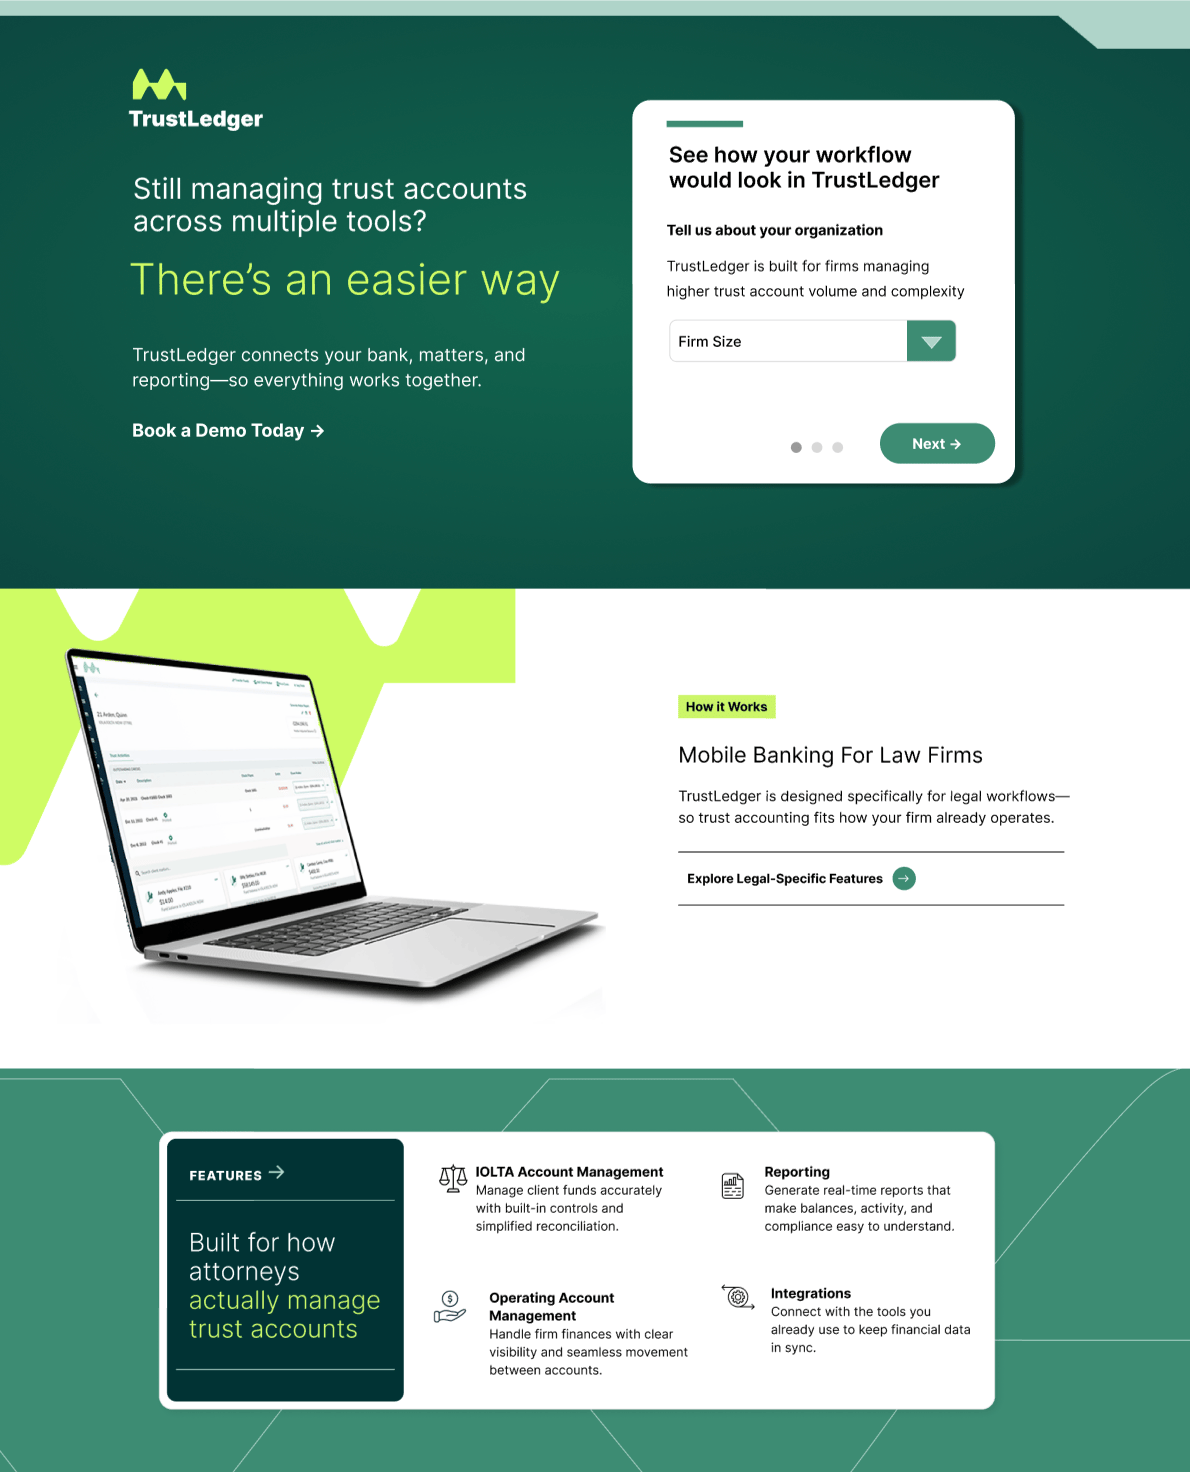
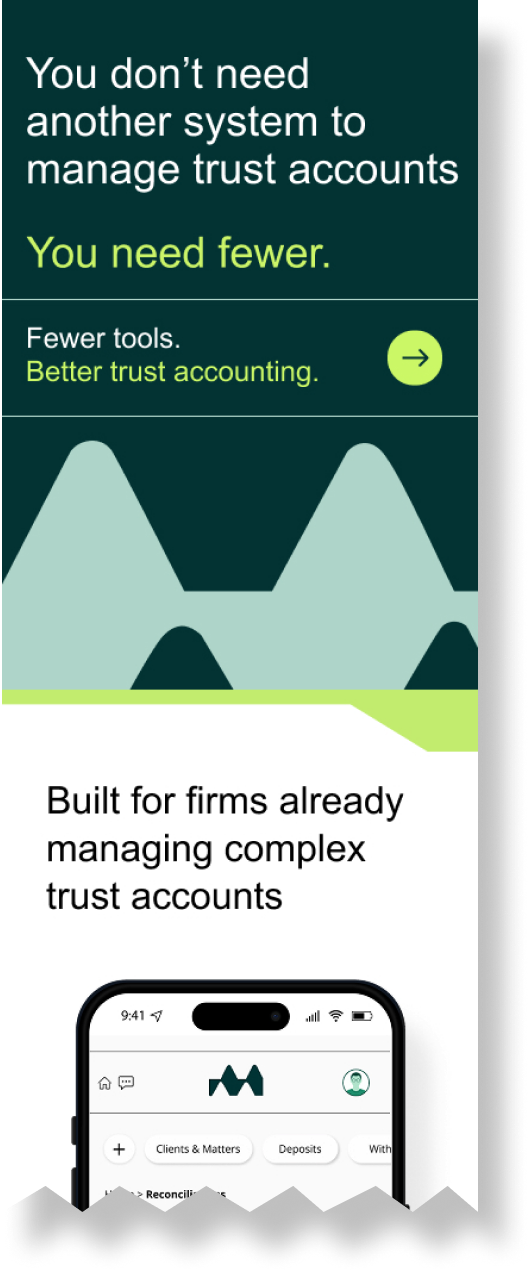
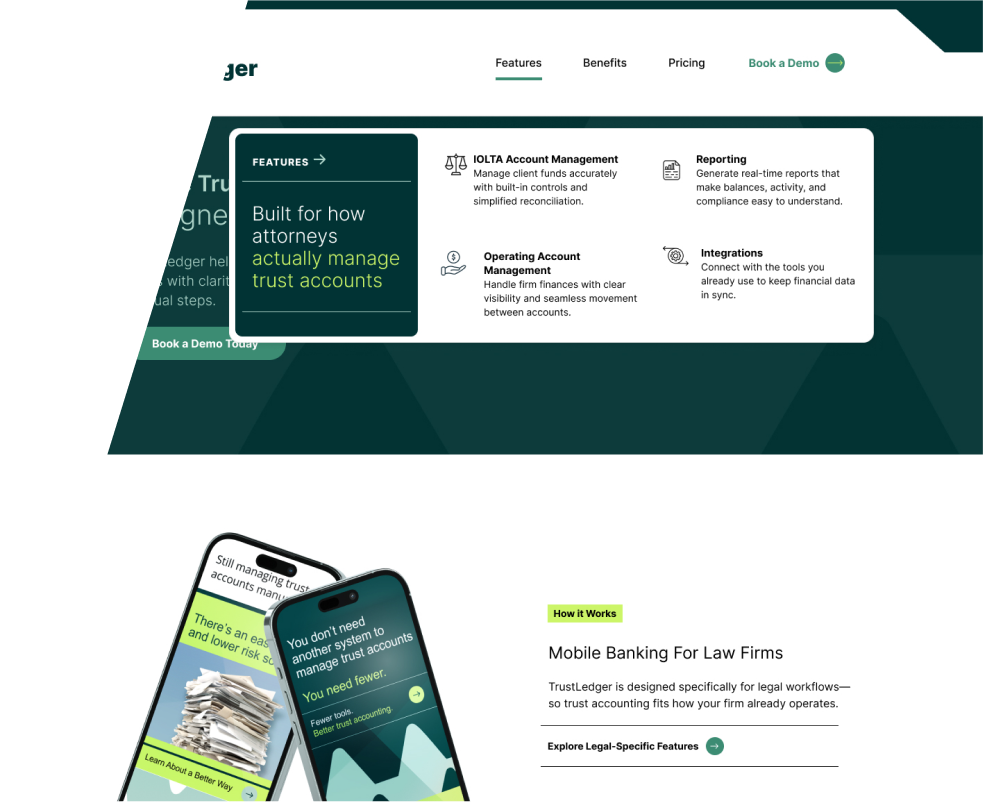
CONVERSION-FOCUSED SITE EXPERIENCE
Designed for Evaluation, Not Just Awareness
I transformed the site from a product overview into a decision-making tool
Shifted site architecture and content strategy from feature-first to decision-stage navigation

Aligned task prioritization with real decision-making needs and maximized organic CVR
BEFORE // Static Nav

AFTER // Personalized Mega Nav
Targeted content strategy
Journey-Based Landing Pages
I designed experiences tailored to stage and intent, mapping content to awareness, consideration, and decision
Structured pages to capture 0P data and improve attribution
Personalized content for ICPs and promising segments

The Impact
From System Design to Measurable Growth
Over an 18-month engagement, the business transformed from generating activity to generating revenue by rebuilding the system around customer behavior, messaging, and measurement.
Once fully implemented, performance accelerated rapidly over a 30-day period:
83
New Customers Acquired

24%
From the Previous Month

78%
Were High-Value Accounts
63%
Accounts with +$500k IOLTA Balances
250%
Increase Organic Acquisition

Lead volume exceeded targets

Growth improved without increasing spend:
117%
Increase in SQL Volume

From the Previous Month
70%
Decrease in CPL

For Paid Media Across Search & Social
177%
Acquisition Efficiency

CAC Across All Channels Dropped
By aligning customer behavior, messaging, and measurement, the business shifted from generating activity to generating revenue.
Growth didn’t come from doing more.
It came from building the right system and letting it work.
Case Studies
Healthcare SaaS • Research • Retention

Trust in the AI Was Lost at Login
Protecting Clinical Momentum in an AI-Powered EHR
A mixed-method research initiative uncovered how authentication friction reduced confidence in AI-assisted documentation and disrupted critical prescribing workflows →
↑ Workflow Continuity • ↑ Clinician Confidence • ↓ Authentication Friction
Higher Ed • Enrollment Strategy • Acquisition

Enrollment Friction Was Limiting Growth
Students Couldn't Find What They Needed to Believe
Organic traffic had successfully scaled, but lead generation performance had plateaued. Behavioral research uncovered gaps that traditional CRO metrics alone couldn't explain →
↑ Strategic Clarity • ↑ Customer Understanding • ↑ Growth Alignment
Pharma • Product Design • Retention

Improving Adoption Through Behavioral Design
Designing Around the Right Support System Changed Everything
Behavioral research, experience redesign, and coordinated support workflows helped users understand what mattered, what to do next, and when intervention was needed →
↑ Onboarding Completion • ↑ 7-Day Retention • ↓ Response Time
My Expertise Delivers For:
Marketing & Growth
Customer Acquisition & Conversion
Journey Mapping & Funnel Optimization
CRM & Retention Strategy
Behavioral Segmentation & Personalization
Landing Page & Onboarding Optimization
Customer Research & Insight Generation
AI-Supported Content & Experience Strategy
Product & CX
UX & Digital Experience Strategy
Onboarding & Adoption Systems
DAP Strategy & Optimization
Service Blueprinting
Customer & Employee Experience
Behavioral Design & Usability Optimization
AI-supported Product & Support Experiences
Strategy & Transformation
Cross-functional Alignment
Experience Transformation Initiatives
Operational Experience Design
Customer Intelligence Systems
Support and Onboarding Optimization
Research-driven Decision-making
AI-supported Workflow and Systems Strategy

Let’s Build Better Systems for People
© 2026 Beth Pavinich. All rights reserved.
All content, case studies, strategy frameworks, written materials, visuals, diagrams, concepts, and supporting artifacts featured on this site are the intellectual property of Beth Pavinich and may not be copied, reproduced, distributed, modified, adapted, republished, or used in whole or in part without prior written permission.
Many projects featured on this site were completed under non-disclosure agreements (NDAs). Client names and proprietary details have been anonymized. Outcomes reflect engagement-specific performance data, client reporting, benchmark analysis, and directional business impact estimates where exact figures cannot be disclosed.
Rebuilding Growth
Around the Right Customer
FinTech • B2B SaaS • DX Strategy • Acquisition
An 18-month system redesign transformed fragmented acquisition for a B2B financial platform into a revenue-driven engine with measurable results in 30 days.
ROLE
CRO & Digital Experience Strategy Consultant
OWNERSHIP
End-to-end acquisition, conversion, and onboarding strategy

Overview
TrustLedger is a fintech platform built for law firms to manage both operating accounts and trust (IOLTA) accounts in a single system.
Most firms rely on disconnected tools: banking platforms, accounting software, and manual reconciliation; creating delays, risk, and operational friction.
TrustLedger unifies financial workflows into a single, real-time system.
The product was strong.
But growth wasn’t.
The Problem
Strong Product. Misaligned Growth.
The issue wasn’t demand.
The system was optimized for activity, not value.
At a glance, performance appeared stable:
Paid media generated leads.
Traffic was consistent.Campaigns were active.
But revenue told a different story:
Lead volume was high, but pipeline quality was inconsistent.Sales cycles were long and unpredictable.Many customers lacked the financial profile to drive meaningful revenue.
The Reality
Multiple Funnels. Conflicting Signals.
Acquisition wasn’t a single funnel, it was a fragmented system.
Paid search targeting broad, mixed-intent queries
Paid social campaigns optimized for awareness, not qualification
Organic traffic driven by weak positioning and poor site architecture
Offline and referral channels driving the majority of actual conversions
Each funnel operated independently.
Each optimized for different behaviors.
But all were measured the same way.
The Diagnosis
Separating Signal from Noise
I led a mixed-method research effort to understand what was actually driving performance.
Data Sources Included:
Sales Insights/Qual Data
Gong, SurveyMonkey
CRM + Pipeline
Hubspot
Conversion + Attribution
GA4, PostHog
Revenue + Account Data
Looker
Behavior + Product Usage
Pendo, DataDog
Channel Performance
GoogleAds, Meta, LinkeIn
This analysis revealed a critical disconnect.
High-value customers followed longer, more complex journeys.Lower-value customers converted quickly—distorting performance metrics.
A key finding:
Average lead-to-close time was ~80 days. Yet, CAC was evaluated in real time using first-touch attribution.
This meant:
- High-value customers were undercounted
- Low-value leads inflated performance
- Channel effectiveness was misunderstood
Findings were operationalized through a detailed report and executive dashboards, built with data engineering and surfaced in BI platforms; the charts below are a small sample used in C-suite readouts.
The Insight
Not All Customers Are Equal
The strategy treated all customers the same, data proved they weren’t. So, I defined key segments and mapped exactly how and where to personalize across the journey.
I Replaced Assumption With Evidence
By mapping data-informed journeys end-to-end, I identified:
Which customers actually generated revenue
Which channels influenced high-value conversion
Where friction existed across the experience
I then detailed the opportunities across acquisition and adoption to attract, engage, and convert users into longtime customers
The Strategy
Rebuilding the System Around the Right Customer
The strategy operated as an integrated system where customer profiles shaped messaging, messaging guided channel strategy, channels drove conversion design, and conversion generated data that continuously refined the entire system creating a feedback loop that improved targeting, messaging, and performance over time rather than relying on isolated campaigns.
I redesigned the growth model as a connected system aligned to customer intent, behavior, and value. Instead of one funnel, I built multiple persona-driven pathways.
This included:

Repositioning messaging around real decision drivers (accuracy, control, compliance)

Aligning paid, organic, and lifecycle channels to different stages of evaluation

Redesigning landing experiences to match entry context

Introducing first-party data capture to identify customer profiles at conversion
crm + lifecycle content
Turning Event Attendees into Qualified Leads
Personalized Flows
I designed email and nurture flows aligned to user intent for ICPs, Promising, and Early-Stage Profiles
Focused Messaging
I wrote content and defined the messaging strategy aligned to real evaluation concerns optimized for maximum CTR and CVR
Personalized ICP Email

Promising Profile Email
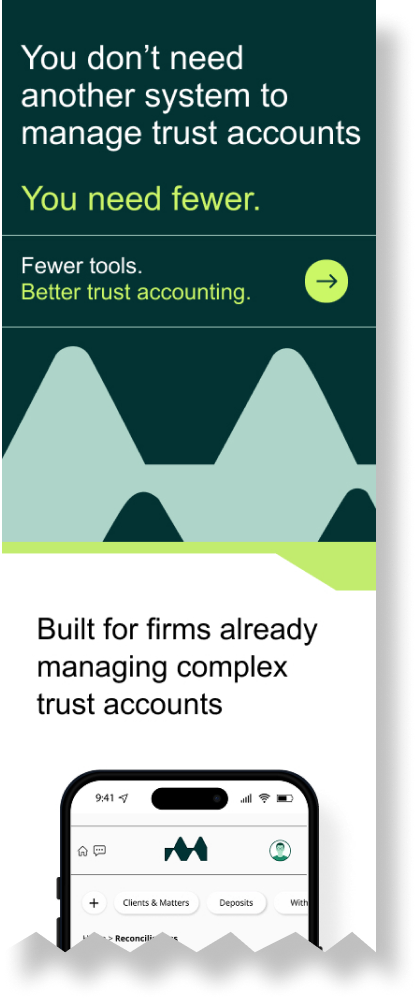
CONVERSION-FOCUSED SITE EXPERIENCE
Designed for Evaluation, Not Just Awareness
I transformed the site from a product overview into a decision-making tool
Shifted site architecture and content strategy from feature-first to decision-stage navigation
Aligned task prioritization with real decision-making needs and maximized organic CVR
BEFORE // Static Nav
AFTER // Personalized Mega Nav


Targeted content strategy
Journey-Based Landing Pages
I designed experiences tailored to stage and intent, mapping content to awareness, consideration, and decision
Structured pages to capture 0P data and improve attribution
Personalized content for ICPs and promising segments
The Impact
From System Design to Measurable Growth
Over an 18-month engagement, the business transformed from generating activity to generating revenue by rebuilding the system around customer behavior, messaging, and measurement.
Once fully implemented, performance accelerated rapidly over a 30-day period:
83
New Customers Acquired
24%
From the Previous Month
78%
Were High-Value Accounts
63%
Accounts with +$500k IOLTA Balances
250%
Increase Organic Acquisition
Lead volume exceeded targets
Growth improved without increasing spend:
117%
Increase in SQL Volume
From the Previous Month
70%
Decrease in CPL
For Paid Media Across Search & Social
177%
Acquisition Efficiency
CAC Across All Channels Dropped
By aligning customer behavior, messaging, and measurement, the business shifted from generating activity to generating revenue.
Growth didn’t come from doing more.
It came from building the right system and letting it work.
Case Studies
Trust in the AI Was Lost at Login
Protecting Clinical Momentum in an AI-Powered EHR
A mixed-method research initiative uncovered how authentication friction reduced confidence in AI-assisted documentation and disrupted critical prescribing workflows →
↑ Workflow Continuity • ↑ Clinician Confidence • ↓ Authentication Friction

Healthcare SaaS • Research • Retention
Enrollment Friction Was Limiting Growth
Students Couldn't Find What They Needed to Believe
Organic traffic had successfully scaled, but lead generation performance had plateaued. Behavioral research uncovered gaps that traditional CRO metrics alone couldn't explain →
↑ Strategic Clarity • ↑ Customer Understanding • ↑ Growth Alignment
Higher Ed • Enrollment Strategy • Acquisition
Improving Adoption Through Behavioral Design
Designing Around the Right Support System Changed Everything
Behavioral research, experience redesign, and coordinated support workflows helped users understand what mattered, what to do next, and when intervention was needed →
↑ Onboarding Completion • ↑ 7-Day Retention • ↓ Response Time
Pharma • Product Design • Retention
My Expertise Delivers For:
Marketing & Growth
Customer Acquisition & Conversion
Journey Mapping & Funnel Optimization
CRM & Retention Strategy
Behavioral Segmentation & Personalization
Landing Page & Onboarding Optimization
Customer Research & Insight Generation
AI-Supported Content & Experience Strategy
Product & CX
UX & Digital Experience Strategy
Onboarding & Adoption Systems
DAP Strategy & Optimization
Service Blueprinting
Customer & Employee Experience
Behavioral Design & Usability Optimization
AI-supported Product & Support Experiences
Strategy & Transformation
Cross-functional Alignment
Experience Transformation Initiatives
Operational Experience Design
Customer Intelligence Systems
Support and Onboarding Optimization
Research-driven Decision-making
AI-supported Workflow and Systems Strategy
Let’s Build Better Systems for People
© 2026 Beth Pavinich. All rights reserved.
All content, case studies, strategy frameworks, written materials, visuals, diagrams, concepts, and supporting artifacts featured on this site are the intellectual property of Beth Pavinich and may not be copied, reproduced, distributed, modified, adapted, republished, or used in whole or in part without prior written permission.
Many projects featured on this site were completed under non-disclosure agreements (NDAs). Client names and proprietary details have been anonymized. Outcomes reflect engagement-specific performance data, client reporting, benchmark analysis, and directional business impact estimates where exact figures cannot be disclosed.
Rebuilding Growth
Around the Right Customer
FinTech • B2B SaaS • DX Strategy • Acquisition
An 18-month system redesign transformed fragmented acquisition for a B2B financial platform into a revenue-driven engine with measurable results in 30 days.
ROLE
CRO & Digital Experience Strategy Consultant
OWNERSHIP
End-to-end acquisition, conversion, and onboarding strategy

Overview
TrustLedger is a fintech platform built for law firms to manage both operating accounts and trust (IOLTA) accounts in a single system.
Most firms rely on disconnected tools: banking platforms, accounting software, and manual reconciliation; creating delays, risk, and operational friction.
TrustLedger unifies financial workflows into a single, real-time system.
The product was strong.
But growth wasn’t.
The Problem
Strong Product. Misaligned Growth.
The issue wasn’t demand.
The system was optimized for activity, not value.
At a glance, performance appeared stable:
Paid media generated leads.
Traffic was consistent.Campaigns were active.
But revenue told a different story:
Lead volume was high, but pipeline quality was inconsistent.Sales cycles were long and unpredictable.Many customers lacked the financial profile to drive meaningful revenue.
The Reality
Multiple Funnels. Conflicting Signals.
Acquisition wasn’t a single funnel, it was a fragmented system.
Paid search targeting broad, mixed-intent queries
Paid social campaigns optimized for awareness, not qualification
Organic traffic driven by weak positioning and poor site architecture
Offline and referral channels driving the majority of actual conversions
Each funnel operated independently.
Each optimized for different behaviors.
But all were measured the same way.
The Diagnosis
Separating Signal from Noise
I led a mixed-method research effort to understand what was actually driving performance.
Data Sources Included:
Sales Insights/Qual Data
Gong, SurveyMonkey
CRM + Pipeline
Hubspot
Conversion + Attribution
GA4, PostHog
Revenue + Account Data
Looker
Behavior + Product Usage
Pendo, DataDog
Channel Performance
GoogleAds, Meta, LinkeIn
This analysis revealed a critical disconnect.
High-value customers followed longer, more complex journeys.Lower-value customers converted quickly—distorting performance metrics.
A key finding:
Average lead-to-close time was ~80 days. Yet, CAC was evaluated in real time using first-touch attribution.
This meant:
- High-value customers were undercounted
- Low-value leads inflated performance
- Channel effectiveness was misunderstood
Findings were operationalized through a detailed report and executive dashboards, built with data engineering and surfaced in BI platforms; the charts below are a small sample used in C-suite readouts.
The Insight
Not All Customers Are Equal
The strategy treated all customers the same, data proved they weren’t. So, I defined key segments and mapped exactly how and where to personalize across the journey.
I Replaced Assumption With Evidence
By mapping data-informed journeys end-to-end, I identified:
Which customers actually generated revenue
Which channels influenced high-value conversion
Where friction existed across the experience
I then detailed the opportunities across acquisition and adoption to attract, engage, and convert users into longtime customers
The Strategy
Rebuilding the System Around the Right Customer
The strategy operated as an integrated system where customer profiles shaped messaging, messaging guided channel strategy, channels drove conversion design, and conversion generated data that continuously refined the entire system creating a feedback loop that improved targeting, messaging, and performance over time rather than relying on isolated campaigns.
I redesigned the growth model as a connected system aligned to customer intent, behavior, and value. Instead of one funnel, I built multiple persona-driven pathways.
This included:

Repositioning messaging around real decision drivers (accuracy, control, compliance)

Aligning paid, organic, and lifecycle channels to different stages of evaluation

Redesigning landing experiences to match entry context

Introducing first-party data capture to identify customer profiles at conversion
crm + lifecycle content
Turning Event Attendees into Qualified Leads
Personalized Flows
I designed email and nurture flows aligned to user intent for ICPs, Promising, and Early-Stage Profiles
Focused Messaging
I wrote content and defined the messaging strategy aligned to real evaluation concerns optimized for maximum CTR and CVR
Personalized ICP Email
Promising Profile Email
CONVERSION-FOCUSED SITE EXPERIENCE
Designed for Evaluation, Not Just Awareness
I transformed the site from a product overview into a decision-making tool
Shifted site architecture and content strategy from feature-first to decision-stage navigation
Aligned task prioritization with real decision-making needs and maximized organic CVR
BEFORE // Static Nav
AFTER // Personalized Mega Nav
Targeted content strategy
Journey-Based Landing Pages
I designed experiences tailored to stage and intent, mapping content to awareness, consideration, and decision
Structured pages to capture 0P data and improve attribution
Personalized content for ICPs and promising segments
The Impact
From System Design to Measurable Growth
Over an 18-month engagement, the business transformed from generating activity to generating revenue by rebuilding the system around customer behavior, messaging, and measurement.
Once fully implemented, performance accelerated rapidly over a 30-day period:
83
New Customers Acquired
24%
From the Previous Month
78%
Were High-Value Accounts
63%
Accounts with +$500k IOLTA Balances
250%
Increase Organic Acquisition
Lead volume exceeded targets
Growth improved without increasing spend:
117%
Increase in SQL Volume
From the Previous Month
70%
Decrease in CPL
For Paid Media Across Search & Social
177%
Acquisition Efficiency
CAC Across All Channels Dropped
By aligning customer behavior, messaging, and measurement, the business shifted from generating activity to generating revenue.
Growth didn’t come from doing more.
It came from building the right system and letting it work.
Case Studies
Healthcare SaaS • Research • Retention
Trust in the AI Was Lost at Login
Protecting Clinical Momentum in an AI-Powered EHR
A mixed-method research initiative uncovered how authentication friction reduced confidence in AI-assisted documentation and disrupted critical prescribing workflows →
↑ Workflow Continuity • ↑ Clinician Confidence •
↓ Authentication Friction
Higher Ed • Enrollment Strategy • Acquisition
Enrollment Friction Was Limiting Growth
Students Couldn't Find What They Needed to Believe
Organic traffic had successfully scaled, but lead generation performance had plateaued. Behavioral research uncovered gaps that traditional CRO metrics alone couldn't explain →
↑ Strategic Clarity • ↑ Customer Understanding •
↑ Growth Alignment
Pharma • Product Design • Retention
Improving Adoption Through Behavioral Design
Designing Around the Right Support System Changed Everything
Behavioral research, experience redesign, and coordinated support workflows helped users understand what mattered, what to do next, and when intervention was needed →
↑ Onboarding Completion • ↑ 7-Day Retention •
↓ Response Time
My Expertise Delivers For:
Marketing & Growth
Customer Acquisition & Conversion
Journey Mapping & Funnel Optimization
CRM & Retention Strategy
Behavioral Segmentation & Personalization
Landing Page & Onboarding Optimization
Customer Research & Insight Generation
AI-Supported Content & Experience Strategy
Product & CX
UX & Digital Experience Strategy
Onboarding & Adoption Systems
DAP Strategy & Optimization
Service Blueprinting
Customer & Employee Experience
Behavioral Design & Usability Optimization
AI-supported Product & Support Experiences
Strategy & Transformation
Cross-functional Alignment
Experience Transformation Initiatives
Operational Experience Design
Customer Intelligence Systems
Support and Onboarding Optimization
Research-driven Decision-making
AI-supported Workflow and Systems Strategy
Let’s Build Better Systems for People
© 2026 Beth Pavinich. All rights reserved.
All content, case studies, strategy frameworks, written materials, visuals, diagrams, concepts, and supporting artifacts featured on this site are the intellectual property of Beth Pavinich and may not be copied, reproduced, distributed, modified, adapted, republished, or used in whole or in part without prior written permission.
Many projects featured on this site were completed under non-disclosure agreements (NDAs). Client names and proprietary details have been anonymized. Outcomes reflect engagement-specific performance data, client reporting, benchmark analysis, and directional business impact estimates where exact figures cannot be disclosed.